Here’s the Q2 2020 Dynamic Brands Fund commentary. We talk about how we generated alpha and where we think markets go from here.
Shake Shak Long Trade - Open

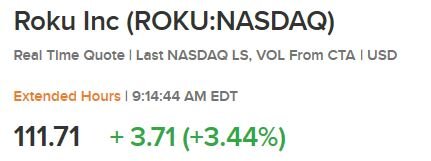
Roku - Open AGAIN

New Trade - 11/7/19
ROKU reported a strong quarter, as usual a bit noisy, there are a lot of moving parts but the secular theme of cord cutting and digital ads migrating to SVOD platforms is early in its life cycle. The stock is down 17% at the open and offers a strong buying opportunity for long term investors and traders.
Buy here at $117.4 for a trade back to $130
Leave a little room to add under $115 but I think the RR is pretty solid right here. This wide channel has a bottom around $110 area and the machines could easily press it down to there where a more robust bounce could occur.
Here’s the full report on the company post-earnings https://www.globalbrandsmatter.com/roku-roku

OLD TRADE - Now closed
Roku - ROKU
Entry: $102.15
Targets: $108-110+ See below
Roku is probably the most mis-understood brands in the 200 Brands Index. This one is a show-me stock but is wedged in the middle of one of the most powerful trends: media consumption. The stock certainly could fall to the $90 solid support but it would just make me more aggressively long. If the stock breaks $90, the bottom of the Bollinger band at $80 could happen very quickly but don’t get shaken out of this stock, buy the dips, carefully and in small tranches given how volatile the stock has been.
10/9/19
Roku caught an upgrade today while there’s rumors of a “skinny trade deal”, whatever that means. I still love Roku’s long-term opportunities but this is a trade log so an 8% gain in this crazy market is a worthwhile gain at the current pre-market level over $111. Who knows if this rally holds, I suspect by the close the averages are flat to down.

Still in a Bull Market or New Bear Market Confirmed?
There’s been a lot of talk about an imminent recession given all the bad news, slowing economic data, etc. I don’t know about you but I do not manage peoples assets based on opinions, I like proof.
How do we know the bull market has finally ended and a bear market has now begun? The answer is we never know with 100% confidence but historically there’s one measure that’s been a pretty good “line in the sand” mark. Below I have posted a chart of the S&P 500 going back to 1990 with a purple line denoting the 200-week moving average. As you can see, the 200 week line is a decent level to assess the difference between a correction in a bull market and a bear market beginning. As you can also see, the really bad things happen once the market breaks down from the 200 week level, currently around 2503 on the S&P.
With all the doom and gloom, am I the only person who’s surprised to see the S&P 500 within 3% of its all time high? Based on the media and investor sentiment one would assume the market has already fallen by 50% given all the headwinds that everyone see’s.
The market is smarter than the news media folks. Build a plan for de-risking and mine is to watch for a weekly break of the 200 week moving average, currently around 2503. Yes, that would not feel good to fall this far and I would likely do some de-risking before 2503 but the major draw-downs tended to happen AFTER we broke the 200-week level.

TRADE LOG
THIS PAGE NEEDS TO BE UPDATED TO DELETE ALL THE CONTENT BELOW AND ADD NEW CONTENT. NOT SURE WHAT YOU WANTED TO TRACK ON THIS PAGE…HISTORICAL PERFORMANCE OF ALL TRADES IS WHAT I BELIEVE YOU WANTED, BUT NEEDS CONTENT….
Generally I am a long-term investor but occasionally I see some highly attractive short-term trades, most of which also come from the Brands 200 index but some can be outside the brands and consumer focus, strictly for a trade. With Trump’s constant tweeting and the Algo-driven world we live in, volatility should stay “spasmic” at the very least, offering some very attractive short-term trade opportunities. DO YOUR OWN RESEARCH, THIS IS NOT INVESTMENT ADVICE AND IS FOR ILLUSTRATIVE PURPOSES ONLY.
The focus: Get in, get paid, get back to cash. Rinse, repeat.
In my opinion, patient traders who wait for the fat pitch can generate some significant returns while only being exposed to the market a small amount of time during the year. This is not an active trading approach, this is a patient, wait until full capitulation presents itself, then pounce approach-primarily.
If you like what you see here, consider putting some of your long-term capital in the Brands Fund me and my partners sub-advise (we took the fund over 10/17/17), it’s great for your IRA or kids college fund. Portfolio holdings are updated regularly here: https://www.globalbrandsmatter.com/dynamic-portfolio
Dynamic Brands Fund info here: http://rationalmf.com/funds/rational-dynamic-brands-fund/

TRADE LOG
9/10/2019

ULTA hits $260 (265 high for the day) target on 10/3/19
Ulta Salon - ULTA - CLOSED, hit target 10/1
Entry: $230.46
Targets: $260
Ulta was a serial outperformer and growth/momentum darling. Based on the way the earnings and guidance were received, there was some serious complacency in the shares down 29% in 1 day. When momentum investors leave the building, they are not shy and often leave skid marks. We had 10x+ daily volume the day after earnings and some strong follow through volume so clearly the shareholder base is turning over a bit. Growth investors will still like this stock and GARP & Core managers will now begin liking it too. I believe management took their medicine and lowered the unreasonable expectations of sales to a more sustainable level. Remember, they are still projecting 6-7% same store sales, that’s still the envy of retail.
The stock is now max oversold and volume has started to trail off making me feel more comfortable to add a tactical long trade to the core holding. Once the stock gets over $230ish we could see the $255/260 level next. That’s the place to take this trade off. I still like it long-term but this is a trade for now.


10/2/2019

10/7/19 initial target of $177+ hit for 7% gain
Workday - WDAY
Entry: 165.41
Target #1 $177 - this is the easier target and should correspond to the QQQ getting back to its top of channel $188 so I’d sell when we see QQQ at this level first try up.
Target #2 $182-185 - I like buying great companies that have some waterfall declines, those big vertical red lines tend to get filled and stocks often rally back to the broken support that becomes resistance. That’s the $182 level for now.
10/7/19: $178 target hit

This cloud HR brand has been a steller performer since the IPO but it’s been getting thumps as all the cloud, software stocks have been under pressure. These companies have strong, long-term growth opportunities but many of them got over-heated and are hella expensive. Many will grow into their valuations and the 2nd tier stocks will never recover, the difference is: the cycle, the category, the competitive advantage and the network effect. I believe Workday will be a long-term winner.

10/2/2019

Amgen - AMGN
Entry: 190.6
Target: Over $192.5 breaks the small downtrend, $198 is next resistance and that big gap around $205 is the target
$198 1st target hit 10/7/2018 but I’ll hold for the $205 target

This top biotech stock is a cash cow and innovator. It’s been resting after a move move that started in 2012 and terminated in 2015, long-term I think this will be a solid investment that beats the market but I like adding this for a trade on the pull-back

10/2/2019

Spotify - SPOT
Entry: $113.6
Target: $120-122 back to broken support shelf. If the stock gets back above that, it has room back to $138-140 but for now it’s just an oversold bounce in a growth stock where growth stock sentiment is currently poor. The stock is oversold and curling up so feels like a decent long entry opportunity.

One of my favorite companies and having a tough year down, I like buying great businesses with huge long-term growth potential when they look terrible. It’s a long-term hold but I like this long trade set-up, catching the falling knife.

10/2/2019

RH high for 10/7/19 was $178
Restoration Hardware - RH
Entry: $167.01
Target: #1 $175 prior peak, #2 >180 and $200 could come quick (top of channel)
Like the next trade, ROKU, RH is highly mis-understood by the market. With roughly 30% of the float short, I’d say there’s some confusion on the business model opportunities. You can read my long-term view of the stock on the dynamic brands tab of this site but from a short-term perspective, RH offers a nice long opportunity from a trading perspective. Over time this is a $10B market cap company, now currently $3.2B so lots of potential upside.
I like taking advantage of this small pullback under $170 to add here at $167 for at least a ride back to the recent high of $175 but over that and the shorts should feel really uncomfortable because that squeeze could be quick to $200.
10/7/2019
RH hit $177 today so that’s a nice gain of 5.9% in crazy market, I’ll take it. I still believe this has much bigger gains next year but this is a trading site.

10/2/2019

Roku - ROKU
Entry: $102.15
Targets: $108-110+ See below
Roku is probably the most mis-understood brands in the 200 Brands Index. This one is a show-me stock but is wedged in the middle of one of the most powerful trends: media consumption. The stock certainly could fall to the $90 solid support but it would just make me more aggressively long. If the stock breaks $90, the bottom of the Bollinger band at $80 could happen very quickly but don’t get shaken out of this stock, buy the dips, carefully and in small tranches given how volatile the stock has been.
10/9/19
Roku caught an upgrade today while there’s rumors of a “skinny trade deal”, whatever that means. I still love Roku’s long-term opportunities but this is a trade log so an 8% gain in this crazy market is a worthwhile gain at the current pre-market level over $111. Who knows if this rally holds, I suspect by the close the averages are flat to down.
10/7/2019

TD Ameritrade - AMTD
Entry: <$34
Target: #1 $37, #2 $39-40 but this could offer a significant long term entry point as well. For now it’s just a max oversold, over-reaction trade.
I do not understand this race-to-zero philosophy all these online brokerages are engaged in and after the pounding all of the stocks took, AMTD in particular on the FREE commissions announcements, but this smash in AMTD appears very overdone. I do not like the precedent they are setting along with Schwab but as a manager of SMA’s for clients, I love the reduction in transaction costs they just got. So I don’t like the long-term implications but from a trading perspective I think there’s $3 of easy money higher for a trade. Let’s assess once we see the strength of this oversold bounce.
Capitulation trades are one of my favorites. AMTD trades around 3.6m shares per day and on October 1 it traded >45m shares with high but lower amounts over the next few days so sellers look like they’ve exhausted themselves so I like this entry under $34.

